


Renewables
Assets and operational data
The PGE Capital Group’s operations in renewable energy are managed by the PGE Energia Odnawialna S.A. Due to the profile of operations, the segment also includes companies from the Offshore area, which are responsible for all activities related to offshore wind energy.
Assets in the segment include:


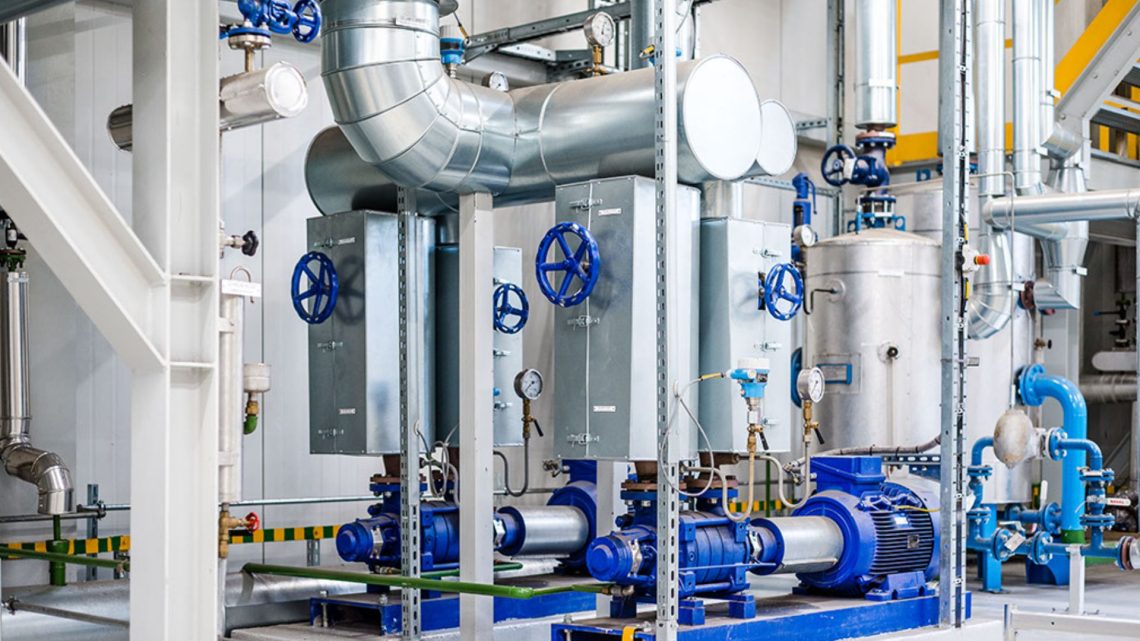
Gas-fired generation
Assets
The Gas-fired Generation segment comprises of 2 units in Gryfino Power Plant, each with an installed capacity of 683 MW fuelled by low-emission gas, and the Rybnik Power Plant in construction (1 unit with a capacity of 882 MW).
On March 4, 2024 unit no. 9 at the Gryfino Power Plant was synchronised with the NPS. On August 14, 2024 the unit was commissioned.
On May 22, 2024 unit no. 10 at the Gryfino Power Plant was synchronised with the NPS. On October 18, 2024 the unit was commissioned.
Main assets of the Gas-fired Generation segment and their installed capacity.


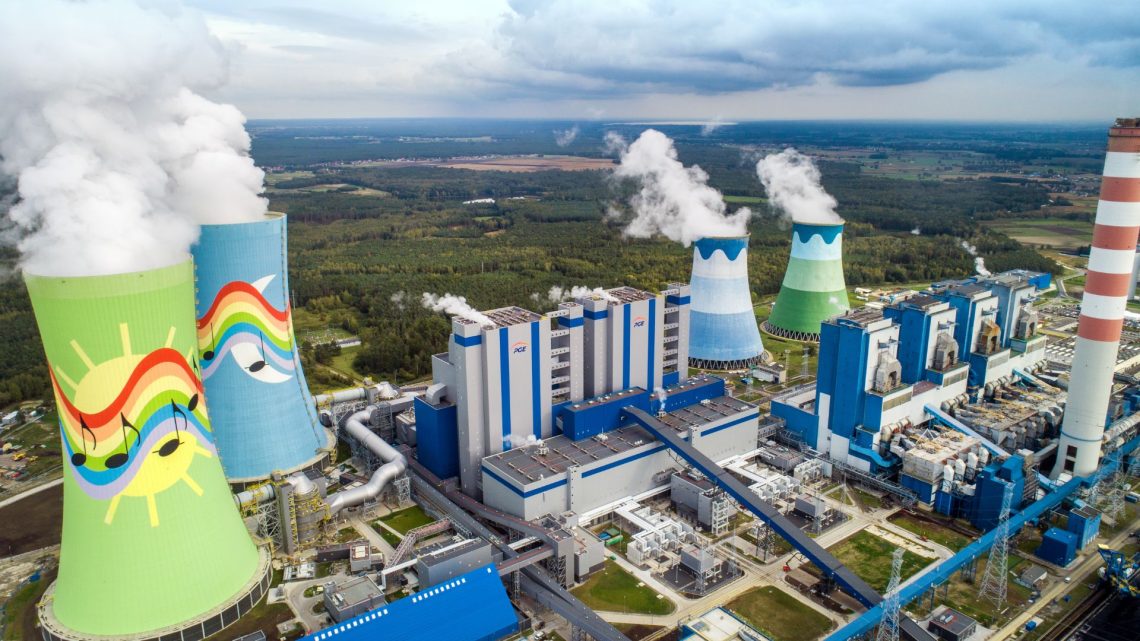
Conventional Generation
Assets
Conventional Generation segment consists of: 2 lignite mines and 5 conventional power plants.
Conventional Generation segment is the leader of lignite mining (its share in the extraction market of this raw material accounting for 95%[1] of domestic extraction), it is also the largest generator of electricity as it generates approx. 29%[2] of domestic gross electricity production. The generation is based on lignite extracted from mines owned by the company as well as hard coal.
Main assets of the Conventional Generation segment with their installed capacity.

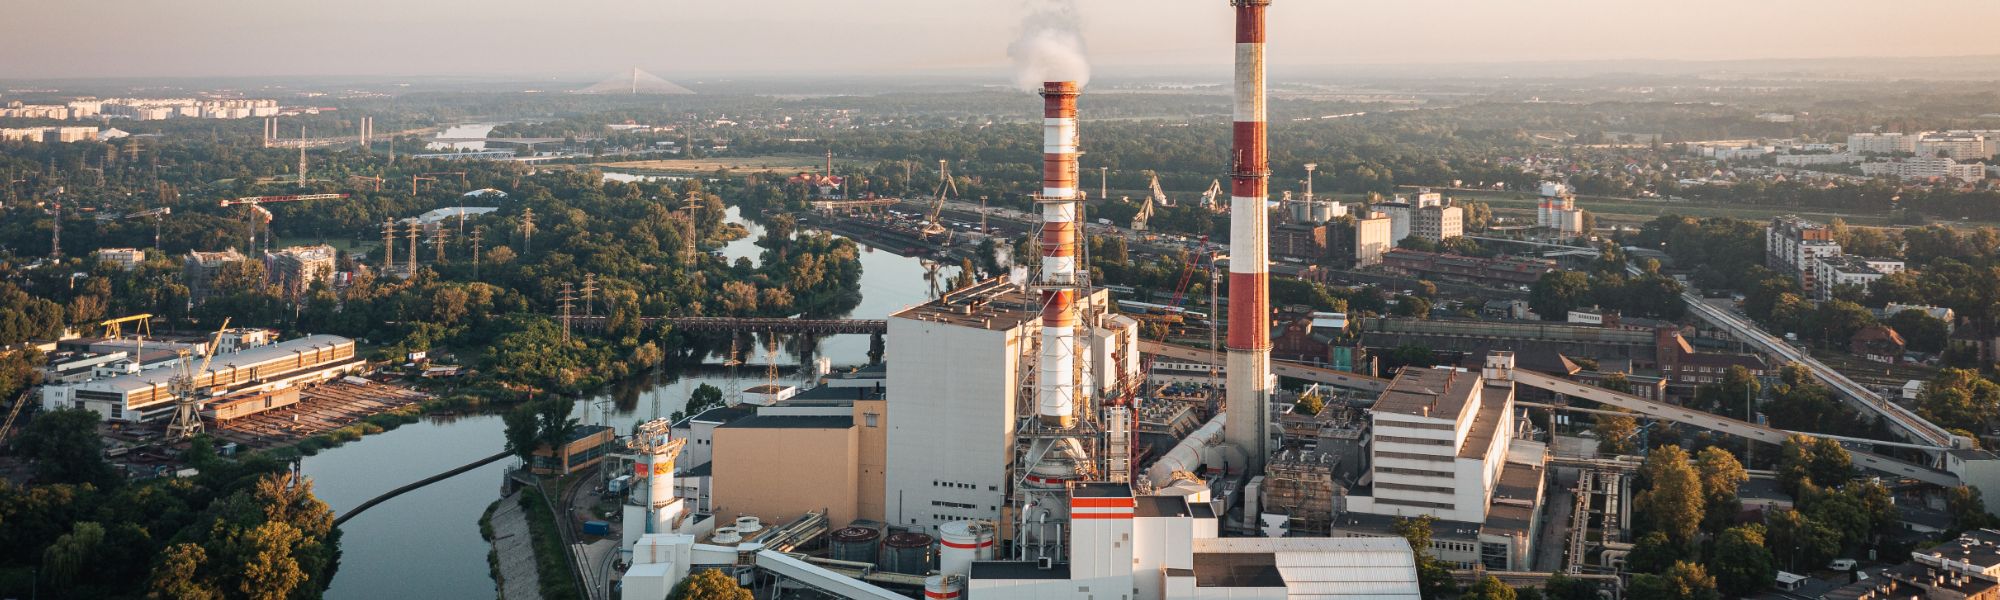

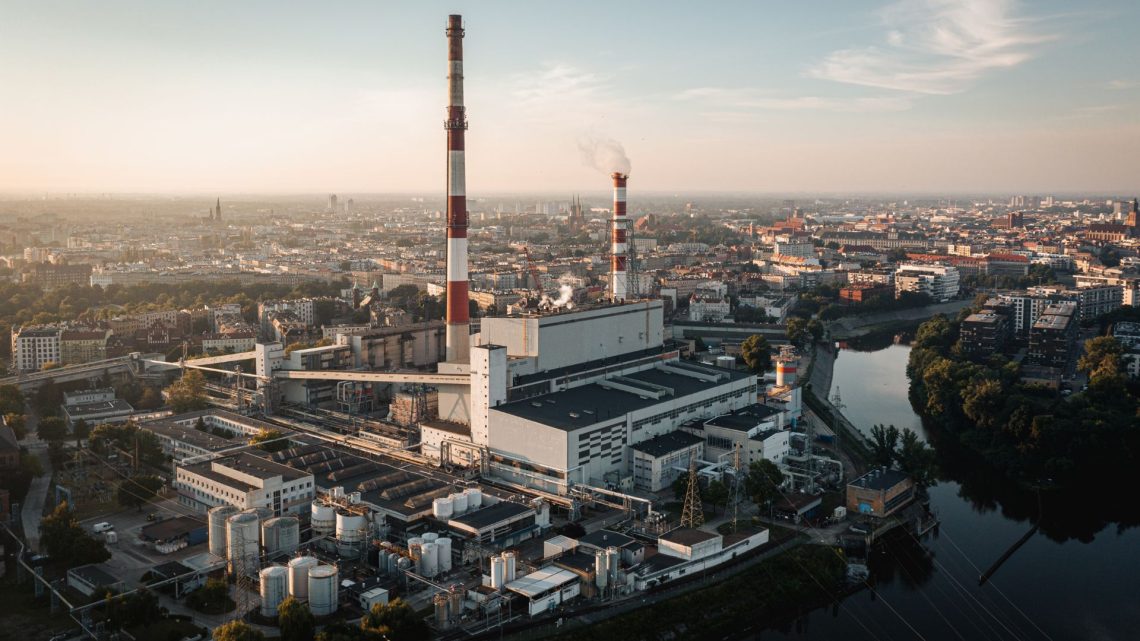
District Heating
Assets
The following companies are included in the segment: PGE Energia Ciepła S.A., KOGENERACJA S.A., EC Zielona Góra S.A., PGE Toruń S.A., MEGAZEC sp. z o.o. and the district heating network in Gryfino.
Currently, the segment includes 16 combined heat and power plants.
District Heating is the largest heat producer in Poland. Generation is based mainly on hard coal and natural gas.
Main assets of the District Heating segment and their installed capacity


Distribution
Area, volumes, customers
PGE Dystrybucja S.A. operates in the area[3] of 129 938 sq. km and delivers electricity to approximately 5.8 million customers.
Main assets of the Distribution segment and their parameters


Railway Energy Services
Volumes, customers and operational data
The main part of the segment’s assets consists of electricity distribution assets held by PGE Energetyka Kolejowa SA. Among other elements, these assets include 545 overhead contact line network substations supplying power to railway lines throughout the country. The total length of the company’s network lines is 18.4 thousand kilometres. The network of PGE Energetyka Kolejowa S.A. serves approximately 57 thousand customers

Main assets of the Railway Energy Services segment and their parameters

* In 2023, data from the date of acquisition, i.e. April 3, 2023.


Supply
Volumes, customers and operational data
** Data for PGE Obrót S.A.

Circular Economy
Other Operations
Core activities of the segment include provision of services to PGE Capital Group, inter alia organisation of capital raising in form of Eurobonds (PGE Sweden), provision of IT ser, provision of security services.
The segment also includes the company PGE Ventures sp. z o.o., which is responsible for investments in start-ups at every stage of the investment cycle: from projects in the earliest phase of development, through projects in the early growth phase, to mature start-ups in the late growth and expansion phase.

[1] Own calculations based on data from Central Statistical Office of Poland.
[2] Own calculations based on data from PSE S.A.
[3] The area of municipalities in which PGE Dystrybucja S.A. operates.